(Aids incidences in the European Union)

| Notation and methological comments (Aids incidences in the European Union) |
| In July 2002, Eurostat presented the number of new AIDS cases per 1 million population in the 15 EU Member States in the time period 1990-2001. These data are based on confirmed samples of performed AIDS tests, which results in respective uncertainties and risks, in particular with respect to underreporting. The 15 Member States are: |
| A Austria |
| B Belgium |
| D Germany |
| DK Denmark |
| E Spain |
| EL Greece |
| F France |
| FIN Finland |
| I Italy |
| IRL Ireland |
| L Luxembourg |
| NL Netherlands |
| P Portugal |
| S Sweden |
| UK United Kingdom |
| Visualisation of new AIDS cases by time series, boxplots or bar charts |
| The new AIDS cases are visualised by using either time series and boxplots for 1990 through 2001 or, for only one user-selected year, by means of bar charts. The weighted EU-15 mean of the AIDs incidences is used as a reference value (population sizes as weights). |
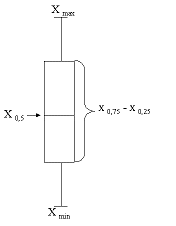
| A bar chart is a graphical tool of descriptive Statistics which represents each element xi of the data set by means of a bar of length xi (i = 1, 2, .. ,n). A boxplot aggregates the information contained in a given data set by displaying only five characteristics of the set. It is defined by a box of length x0,75 – x0,25 (interquartile range), the median x0,5 (marked inside the box) and the two extreme values xmin and xmax of the data set. The latter are connected with the box via two lines. |
 |