Notes and methodological comments
(Capital-city regions in Europe 2000) |
| |
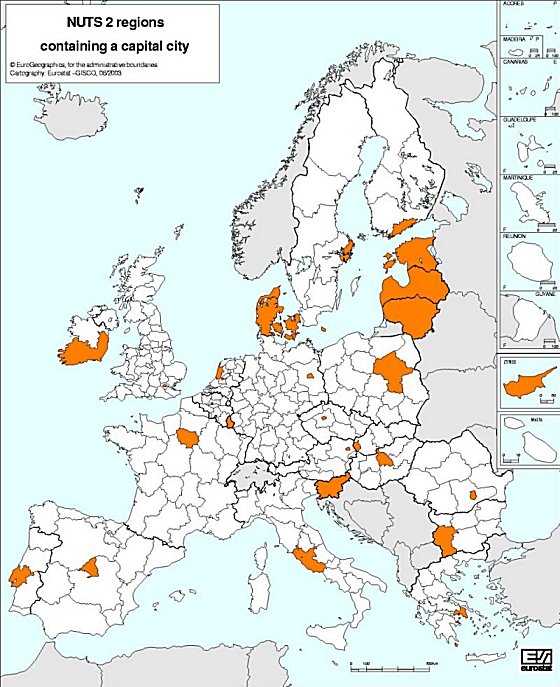
| This applet deals with Eurostat data, for some eight different social and economic variables, from one region each of the 15 EU member states and the 12 accession countries, referring to the year 2000. In each instance, the region studied is the NUTS 2 region containing the capital of the country. NUTS is the French acronym for the nomenclature of territorial units for statistics. It represents a hierarchical classification (NUTS 1, NUTS 2, NUTS 3). Most countries are subdivided into several NUTS 1 regions which are subdivided in NUTS 2 regions and so on. |
| |
| Nature of regions and the reference year |
| |
| It is important to note that these regions are not the same as the capital cities themselves. In certain cases (such as Inner London) the city and its suburbs extend far beyond the NUTS 2 region containing the heart of the city. By contrast, some other NUTS 2 regions in the selection may be vastly bigger than the capital city. In the case of two current Member States (Denmark and Luxembourg) and no fewer than six accession countries (Cyprus, Estonia, Latvia, Lithuania, Malta and Slovenia), the whole country is a NUTS 2 region. |
| |
| Names and abbreviations of countries and their "capital-city regions" |
| |
| The 15 Member States and their "capital-city" regions are: |
| |
| Country |
NUTS 2 code |
Region name |
|
|
AT13 |
Wien |
|
|
BE1 |
Bruxelles-Capitale |
|
|
DE3 |
Berlin |
|
|
DK |
Danmark |
|
|
ES3 |
Comunidad de Madrid |
|
|
GR3 |
Attiki |
|
|
FR1 |
Île de France |
|
|
FI16 |
Uusimaa (suuralue) |
|
|
IT6 |
Lazio |
|
|
IE02 |
Southern and Eastern |
|
|
LU |
Luxembourg |
|
|
NL33 |
Noord-Holland |
|
|
PT13 |
Lisboa e Vale do Tejo |
|
|
SE01 |
Stockholm |
|
|
UKI1 |
Inner London |
| |
| The 12 accession countries and the corresponding "capital-city" regions are: |
| |
| Country |
NUTS 2 code |
Region name |
|
|
BG04 |
Yugozapaden |
|
|
CY |
Kypros / Kibris |
|
|
CZ01 |
Praha |
|
|
EE |
Eesti |
|
|
HU01 |
Kozep-Magyarorszag |
|
|
LT |
Lietuva |
|
|
LV |
Latvija |
|
|
MT |
Malta |
|
|
PL07 |
Mazowieckie |
|
|
RO08 |
Bucuresti |
|
|
SI |
Slovenija |
|
|
SK01 |
Bratislavsky |
| |
| The following map illustrates the above regions. |
| |
 |
| |
| Visualisation of social and economic variables |
| |
| This interactive element visualises for two sets of European countries (15 EU member states or, alternatively, 12 EU accession countries) the relative values for eight different social and economic variables. The visualisation is carried out by means of bar charts. |
| |
| A bar chart is a graphical tool of descriptive Statistics which represents each element xi of a given data set by means of a bar of length xi (i = 1, 2, .. ,n). |
| |