| |
| |
  |
| |
| Hourly labour costs in the Member States |
| |
| |
| Figure 1 presents by means of bar charts the columns of Table 1 refering to Portugal and Sweden, countries with particularly low or high labour costs, respectively. |
| |
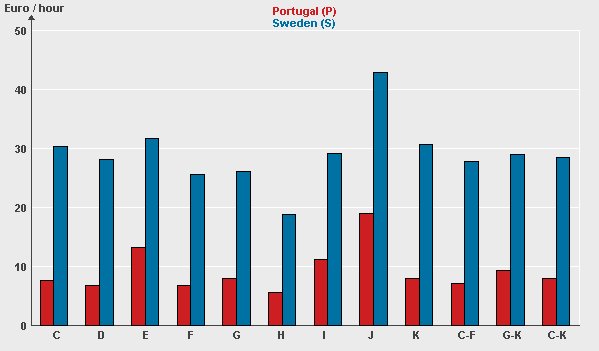 |
| Figure 1: Hourly labour costs for Portugal and Sweden in Euro, 2000 |
| |
| You may visualise by means of bar charts also any other pair of columns of Table 1 (comparison of two countries with respect to all economic activities considered) and also any pair of rows of the table (comparison of two NACE sections or aggregates of sections with respect to all countries) by starting a Java applet. Please read first the hints for optimal use. |
| |
| How to use the applet |
| Java applet "Hourly labour costs in the Member States 2000" |
| |
| |
| |