| |
| |
  |
| |
| Hourly labour costs in the Member States |
| |
| |
| Figure 2 aggregates the information contained in Table 1 by displaying boxplots for countries (comparison of hourly labour costs for countries over all economic activities). Every boxplot represents a row of table 1. The boxplots relating to Greece and Sweden are highlighted. |
| |
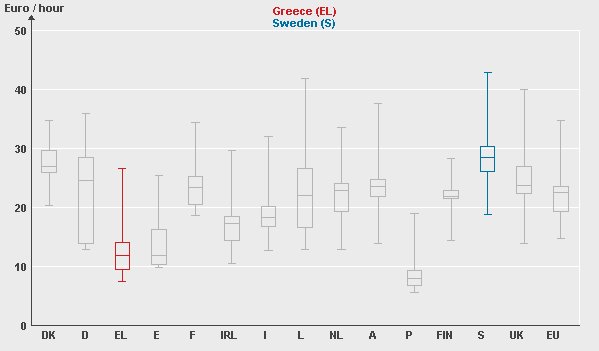 |
| Figure 2: Boxplots displaying hourly labour costs for the Member States |
| |
| You may also display boxplots for the columns of Table 1 (comparison of hourly labour costs for economic activities over all countries) by starting a Java applet. |
| |
| Java applet "Hourly labour costs in the Member States 2000" |
| |
| The economic activities or countries related to the highest or lowest hourly labour costs may be identified by putting the mouse on the upper or lower part of the boxplot. |
| |
| |
| |