| |
| |
  |
| |
| Hourly labour costs in the Candidate Countries |
| |
| |
| Figure 3 displays bar charts representing the rows of Table 2 referring to Bulgaria and Cyprus. These countries reported particularly low and high labour costs, respectively. One should note that compared to the previous figures for Member States, the vertical axis in Figure 3 and also in Figure 4 coming next, is scaled up (stretching factor 2.5). |
| |
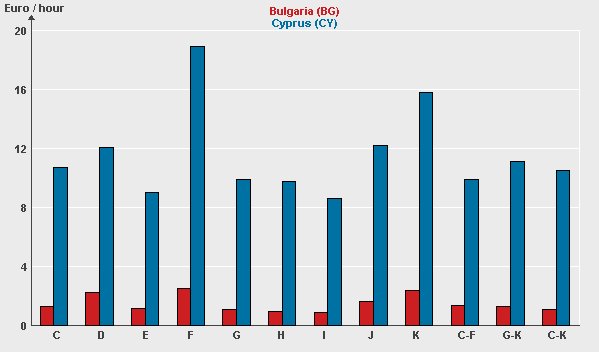 |
| Figure 3: Hourly labour costs for Bulgaria and Cyprus in Euro, 2000 |
| |
| By starting again a Java applet, you may generate bar charts for any other pair of rows of Table 2 (comparison of two countries with respect to all economic activities) and also for any pair of columns of the table (comparison of two NACE sections with respect to all countries). |
| |
| How to use the applet |
| Java applet "Hourly labour costs in the Candidate Countries 2000" |
| |
| |
| |