| |
| |
  |
| |
| Hourly labour costs in the Candidate Countries |
| |
| |
| Figure 4 presents Table 2 by using boxplots as graphical tools. The figure visualizes hourly labour costs for countries over all NACE sections. Every boxplot represents a row of table 2. The boxplots referring to Cyprus and Romania are highlighted. |
| |
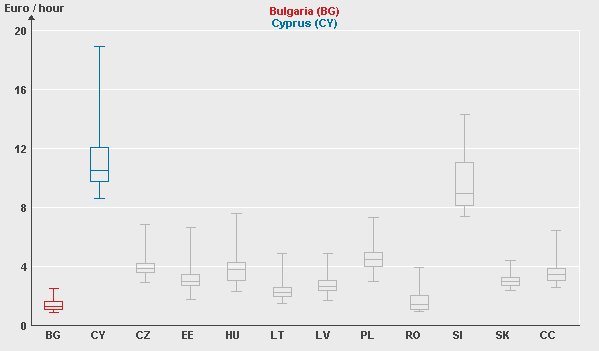 |
| Figure 4: Boxplots displaying hourly labour costs for the Candidate Countries |
| |
| You may also display boxplots for the columns of Table 2 (comparison of hourly labour costs for economic activities over all countries) by starting a Java applet. |
| |
| Java applet "Hourly labour costs in the Member States 2000" |
| |
| The countries or NACE sections connected with the highest or lowest labour costs may be identified by moving the mouse to the upper or lower part of the boxplot. |
| |
| |
| |